Adobe Flash has been discontinued and this page is being converted to YouTube .
To view the videos below please download Adobe Flash Player.
ReportPortal
is a client application that provides access to various data sources
over the Internet. The application requires no client side software other
the Internet Explorer 5.5 or higher, Firefox, Safari or Chrome.
The application offers a role based security model. User and roles can be
assigned to reports and folders as a reader, approver or as a publisher
.
Microsoft Analysis Services allows the security to be implemented on the data cell level.
To implement this, Analysis Services has to be properly set up
.
Report usage logging will record any activity performed by users including:
creating, editing, changing security options, viewing and deleting.
ReportPortal supports localization and customization using dynamic style themes.
The application is written using Microsoft technologies: JavaScript AJAX,
ASP.NET, VB.NET, and Microsoft SQL Server. It also uses Microsoft XML for
Analysis for OLAP data access.
ReportPortal provides access to Microsoft SQL Server Analysis Services
OLAP data using the following reports:
Report Type |
Description |
| OLAP report |
A pivot table that lets user design the report
online by dragging and dropping measures,
dimensions and levels.
This report provides:
- Three data navigation modes: Drill-down
, Expand
and Expand All
- Advanced charting including map and combination charts
- Custom geo maps
- Ability to add and use calculated measure
- Ability so save and reuse MDX named sets between reports
- Filtering by single or multiple member, date picker or value
- Member search
- MDX support
- Member properties support
- Actions support
- Cell Write-Back support
- Comments � for the entire report or a cell
- Conditional formatting
- Export to: Excel
and HTML
- Ability to limit set to top (bottom) N members
- Drillthrough to detail
- Ability to display empty items
- Ability to auto sum, average, min or max
- Ability to transpose axis (swap rows for columns)
- Sorting
- Percentages
- Paging
- Printing
- Email
- Snapshot
- Zoom-in
|
| Microsoft OWC (Office Web Components) report
|
A pivot table that lets user design the report online by
dragging and dropping measures, dimensions and levels.
This report requires that Microsoft Office Web Components
are installed on the client machine. The application will
detect and help install the required components.
This report provides:
- Charting
- Filtering by single or multiple member or value
- Ability to add and use calculated measure (XP and up)
- Ability to limit set to top (bottom) N members (XP and up)
- Sorting
- Percentages
- Ability to create and use disconnected report (local cube)
- Member search
- MDX support
- Member properties support
- Actions support
- Cell Write-Back support
- Comments � for the entire report or a cell
- Export to: Excel, HTML and GIF
- Drillthrough to detail
- Printing
- Email
- Snapshot
|
| Analysis Services 2005 KPI report
|
This report lets users view Key Performance
Indicators created in the Analysis Services 2005.
This report provides:
- Filtering by single or multiple member
- Ability to link a KPI to an external report
- Export to HTML
- Printing
- Email
|
| Data mining report
|
This report lets user browse data mining models created
in the Analysis Services. This report provides:
- Decision Tree and Clustering Mining Model
- Export to HTML
- Paging
- Printing
- Email
|
ReportPortal provides Data Visualization reports for OLAP
data using the following reports:
Report Type |
Description |
|
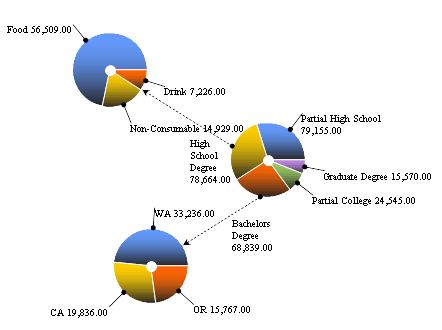
Pie-Chart report
|
Pie-Chart report gives the ability to visualize
multiple dimensions on a single page.
|
|
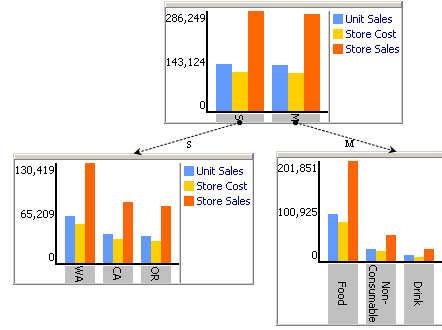
Bar-Chart report
|
Bar-Chart report gives the ability to visualize multiple dimensions on a
single page. This information visualization method allows more than one measure
can be selected as opposed to only a single measure for Pie-Chart Tree.
|
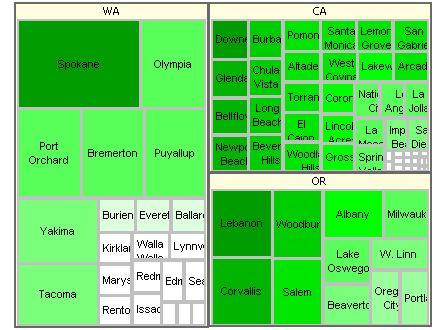
| Tree Map report
|
Tree-Map report gives the ability visualize
a lot of data on a single page.
The user can select two levels (detail and grouping)
and two measures (size and color).
|
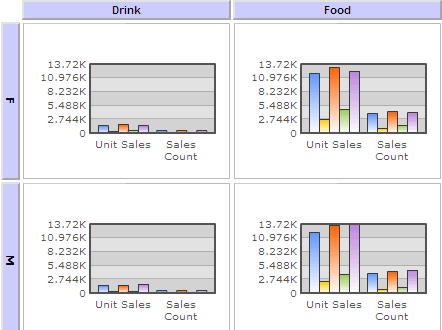
| Chart Grid report
|
Chart Grid report gives the ability see many charts on a single page.
The user can select three levels (for data points, rows and columns)
and many measures.
|
ReportPortal provides access to Relational Data Sources
using the following reports:
Report Type |
Description |
ROLAP report
|
A pivot table that lets user design the report
online by dragging and dropping measures, dimensions and levels.
This report provides:
- Two data navigation modes: Drill-down and Expand
- Advanced charting including map and combination charts
- Ability to design cubes online
- Filtering by single or multiple member, textbox, checkbox or date picker
- Provides access to multiple databases: Sql Server, Access, MySql, Oracle, and DB2.
- SQL Support
- Aggregation of fact table can be created or used
- Fact table partition support
- Printing
- Email
- Export to: Excel and HTML
|
| SQL report
|
A tabular report that is designed online by using an SQL builder.
This report provides:
- SQL Builder (supports stored procedures and functions)
- SQL Tutorial
- Filtering with dropdown, textbox or checkbox
- Printing
- Email
- Export to Excel
- Snapshot
- Zoom-in
|
| Crystal report
|
This report allows viewing of Crystal Reports. This report supports:
- Multiple versions of Crystal Reports: 8.0 and up
- Filtering with dropdown, textbox or checkbox
|
| Reporting Services report
|
This report allows designing and viewing of Microsoft Reporting Services reports.
This report provides:
- Basic Report Builder (supports groupings)
- Using existing Reporting Services reports using URL Access
|
ReportPortal also provides other reports to help you Organize information:
Report Type |
Description |
| Dashboard report
|
Dashboard report puts multiple reports on a single web page.
This report provides:
- Tabs support
- Ability to drag sub-report inside of a tab and across tabs.
- Filters for OLAP Report
- Option to have horizontal and vertical report groups for each tab
- Ability to resize of groups and sub-reports
- Ability to apply a style theme for a report.
- Dashboard classic supports absolute positioning of each sub report.
|
Key Performance Indicators
(KPI) Report
|
KPI report gives the ability do design and view KPI reports.
This report provides:
- Ability to design a KPI based on existing OLAP or SQL report
- Goal value can be based on a report or just a number
- Ability so elect from a range of icons
- Ability to define green-to-yellow and yellow-to-red thresholds
- Ability to link a KPI to an external report
- Comments for each KPI
- Refreshing for each KPI
|
| File upload
|
Any file type can be uploaded into the application.
The file is stored in the database.
|
| Hyperlink
|
A hyperlink can be created to an external page.
It has all the properties of a report.
The hyperlink can be a web folder.
|
Data Entry form
|
Data Entry form provides:
- Ability to quickly design a data entry form to edit, add and delete data in a table.
- Ability to add and remove related records to a cross refernce table.
- Ability to explore the data and relationships between data elements.
|
| Wiki
|
Wiki report provides:
- Ability to create and vew HTML page and drawings using an online editor
- Ability to comment and to reply to comments
- Ability to view and compare previous version
- Ability to for users to subscribe to changes
|
| Blog
|
Blog report provides:
- Ability to display text/html entries in a reverse-chronological order.
- Blog entries are created using online HTML editor.
The HTML editor provides the ability to create a link to another report, add uploaded image and to embed report or a folder contents.
- Ability to comment on each blog entry
|
 Report Portal