Using Charts
Click the "Chart" toolbar icon and select the chart type you would like to view.
The chart Options tab allows changing chart settings.
HTML and Flash charts have their own special settings.
Once selected, the chart will be saved and available when the report is opened.
- Show data for lowest level (hide parent data) - show chart data on the lowest level
- Switch chart axis - move rows to columns and columns to rows
- Height - chart height in pixels
- Width - chart width in pixels
- Chart position:
- Top
- Bottom
- Right
- Left
- No Table - hides data grid
- Chart Ceilings - Y axis top.
- Chart Floor - Y axis bottom.
- Legend
- Show Legend - Shows / Hides chart legend
- Legend width - Legend width in pixels
- Legend Position - Right or Left relative to the chart
- Flash
- Enable Flash Animation - show animation on chart load
- Show Values - show value for each bar
- Chart Color Palette - choose slightly different color scheme
- Place Values Inside - place values inside of the data bars. Will be visible only if "Show Values" option is checked.
- Rotate Values - show values vertically. Will be visible only if "Show Values" option is checked.
- Rotate Labels - show labels vertically.

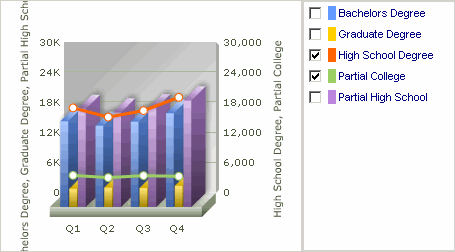
If the drill down is selected, the chart becomes interactive.
When a chart element (bar, slice or a line-chart node) is clicked,
the report will be expanded or filtered by the clicked element.
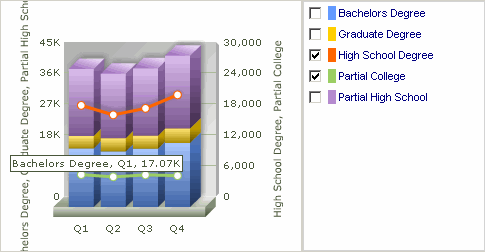
If you hold the mouse longer over the chart element the tool tip with numeric value and
description will be shown.
HTML Charts
HTML chart does not require any external components to be installed in the client browser.
For this chart type, when the mouse cursor moves over the chart the
legend will scroll to the selected member
and the cell in the result table will be highlighted.
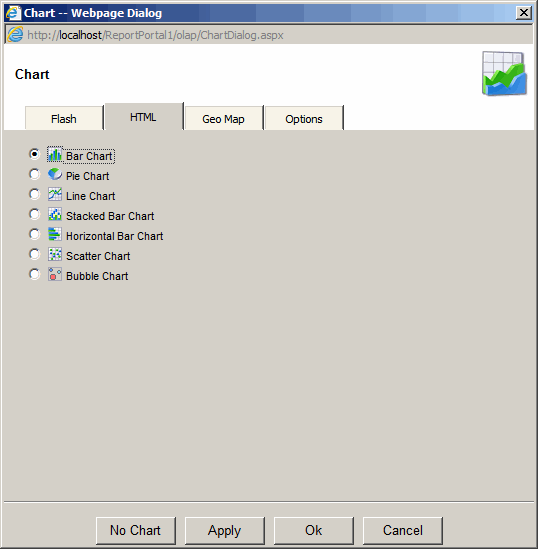
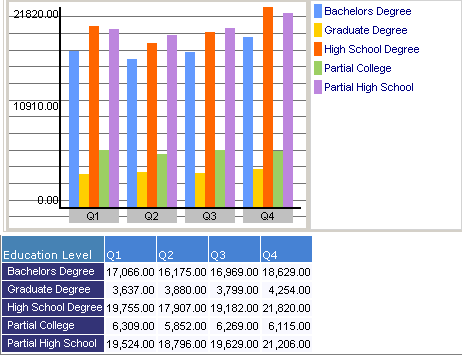
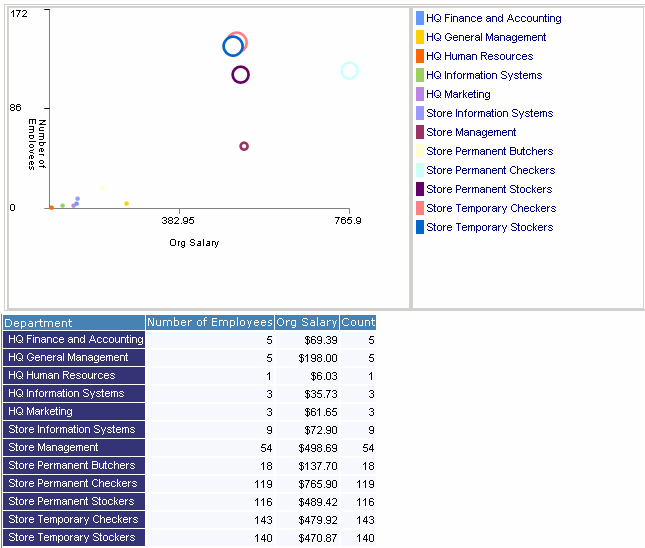
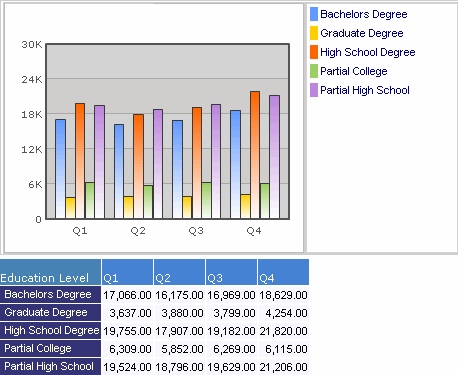
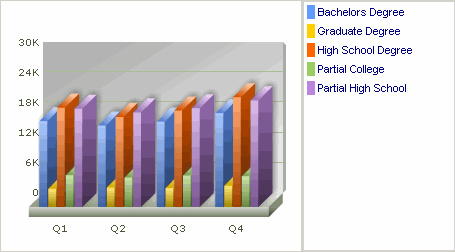
Bar Chart
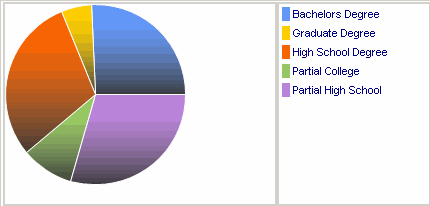
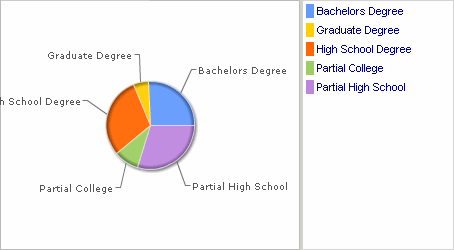
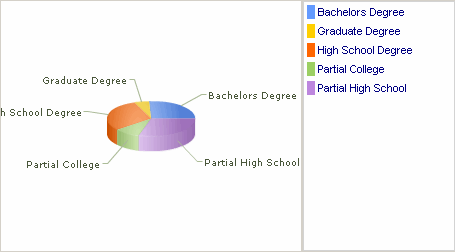
Pie Chart
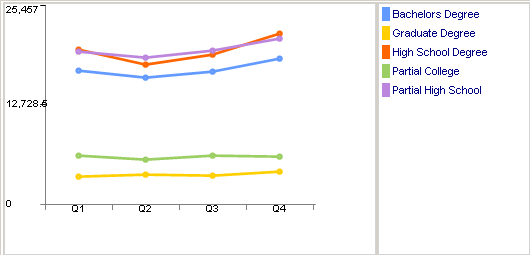
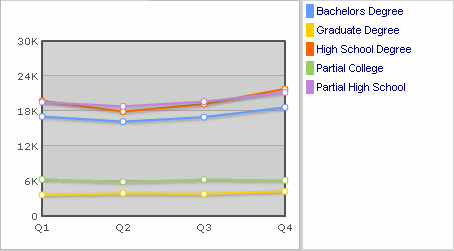
Line Chart
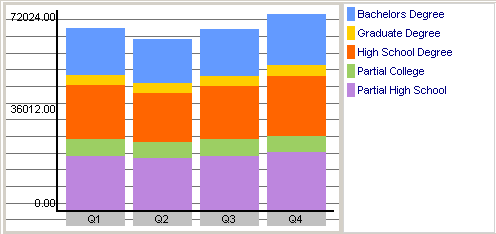
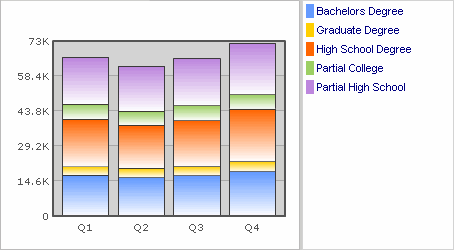
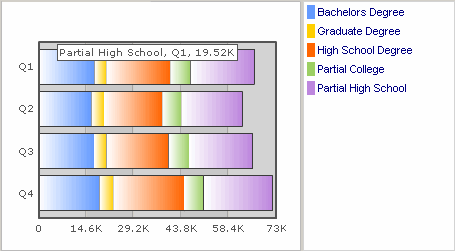
Stacked Bar Chart
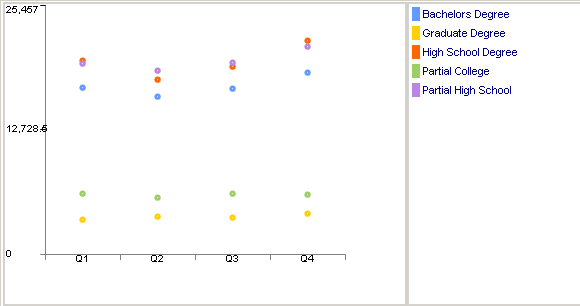
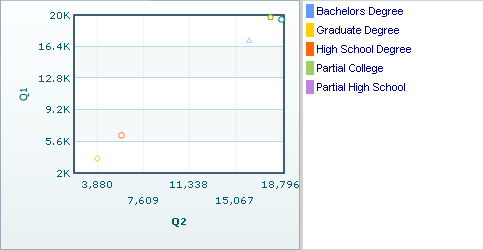
Scattered Chart
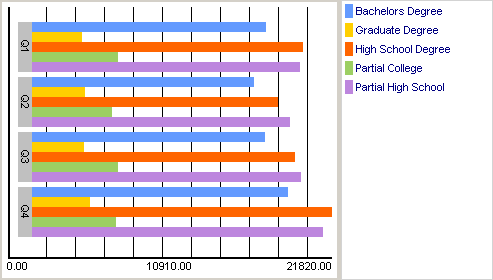
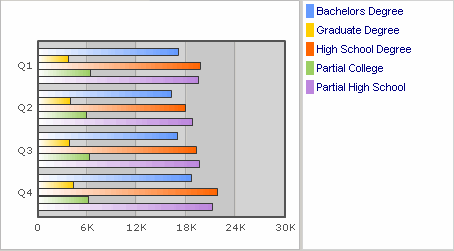
Horizontal Bar Chart
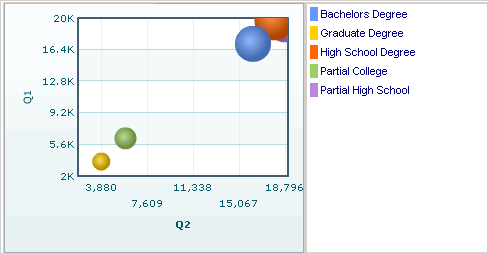
Bubble Chart
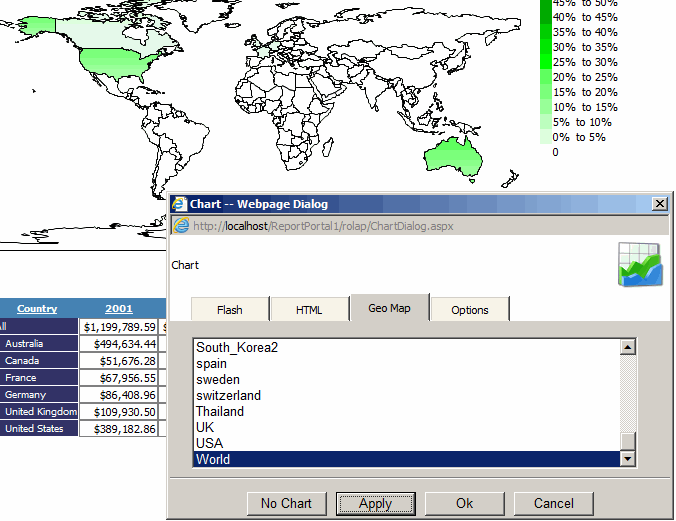
Geo Chart
Geo Chart lets you create a map chart based on XML files located in
C:\inetpub\wwwroot\ReportPortal\olap\Maps.
Flash Charts
Flash charts need Macromedia Flash 8 or higher
to be installed on the client PC.
If flash is not installed, the application
will help the user install it.
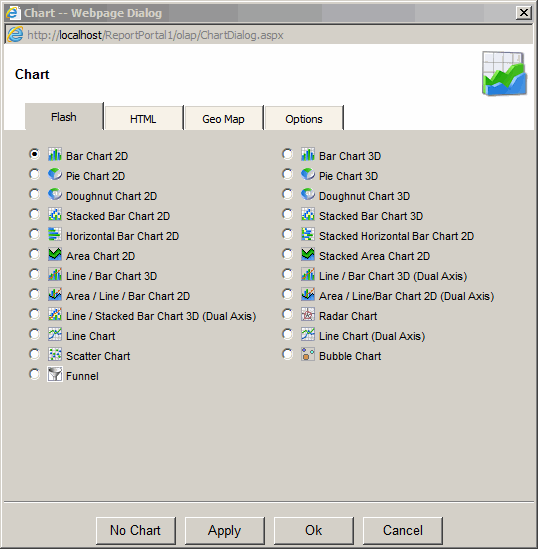
Bar Chart 2D
Bar Chart 3D
Pie Chart 2D
Pie Chart 3D
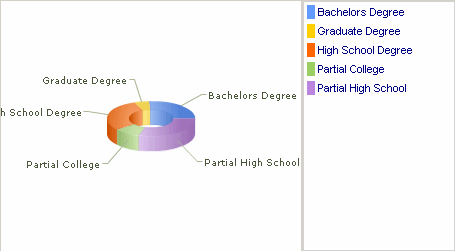
Doughnut Chart 2D

Doughnut Chart 3D
Line Chart
Stacked Bar Chart 2D
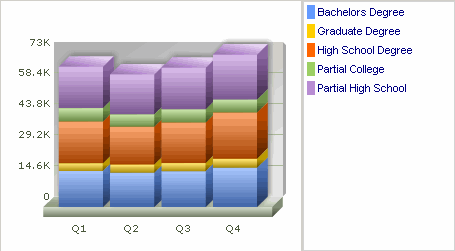
Stacked Bar Chart 3D
Horizontal Bar Chart 2D
Stacked Horizontal Bar Chart 2D
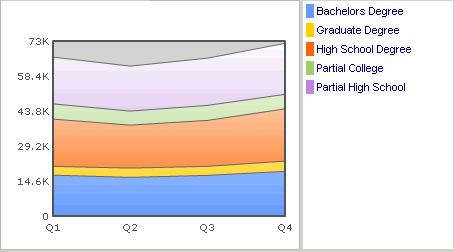
Area Chart
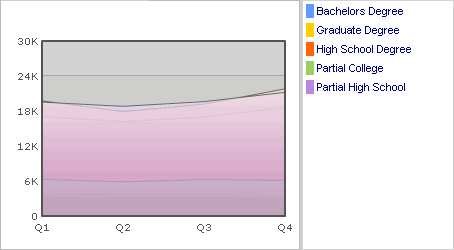
Stacked Area Chart
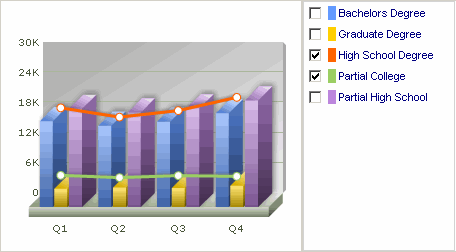
Bar/Line Chart 3D
Bar/Line Chart 3D (Dual Axis)
Area/Bar/Line Chart 2D
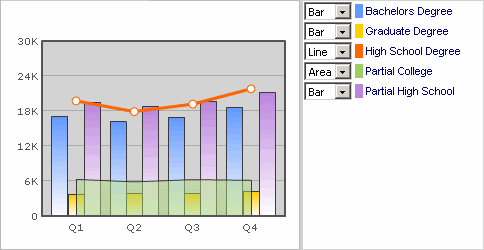
Area/Bar/Line Chart 2D (Dual Axis)
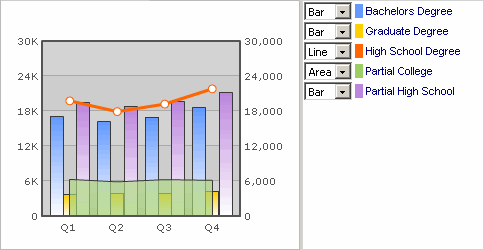
Stacked Bar/Line Chart 3D (Dual Axis)
Scatter Chart
Bubble Chart
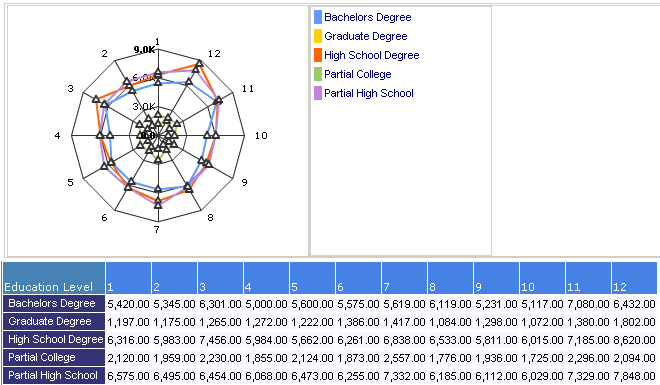
Radar Chart